When I started analyzing Amazon product returns, my goal was simple but important: I wanted to understand patterns by region, specifically by state and province.
I was trying to answer questions like:
- Do some regions consistently have higher return rates?
- Are certain fulfillment centers associated with more issues?
- Are there geographic or environmental patterns that could inform inventory, packaging, or product strategy?
Very quickly, I ran into a limitation in Amazon's own reporting.
The Core Problem: Geography Is Hidden Behind Internal Codes
In Amazon's standard Returns reports:
- There is no column for state, province, or city
- The only location-related field provided is
fulfillment_center_id
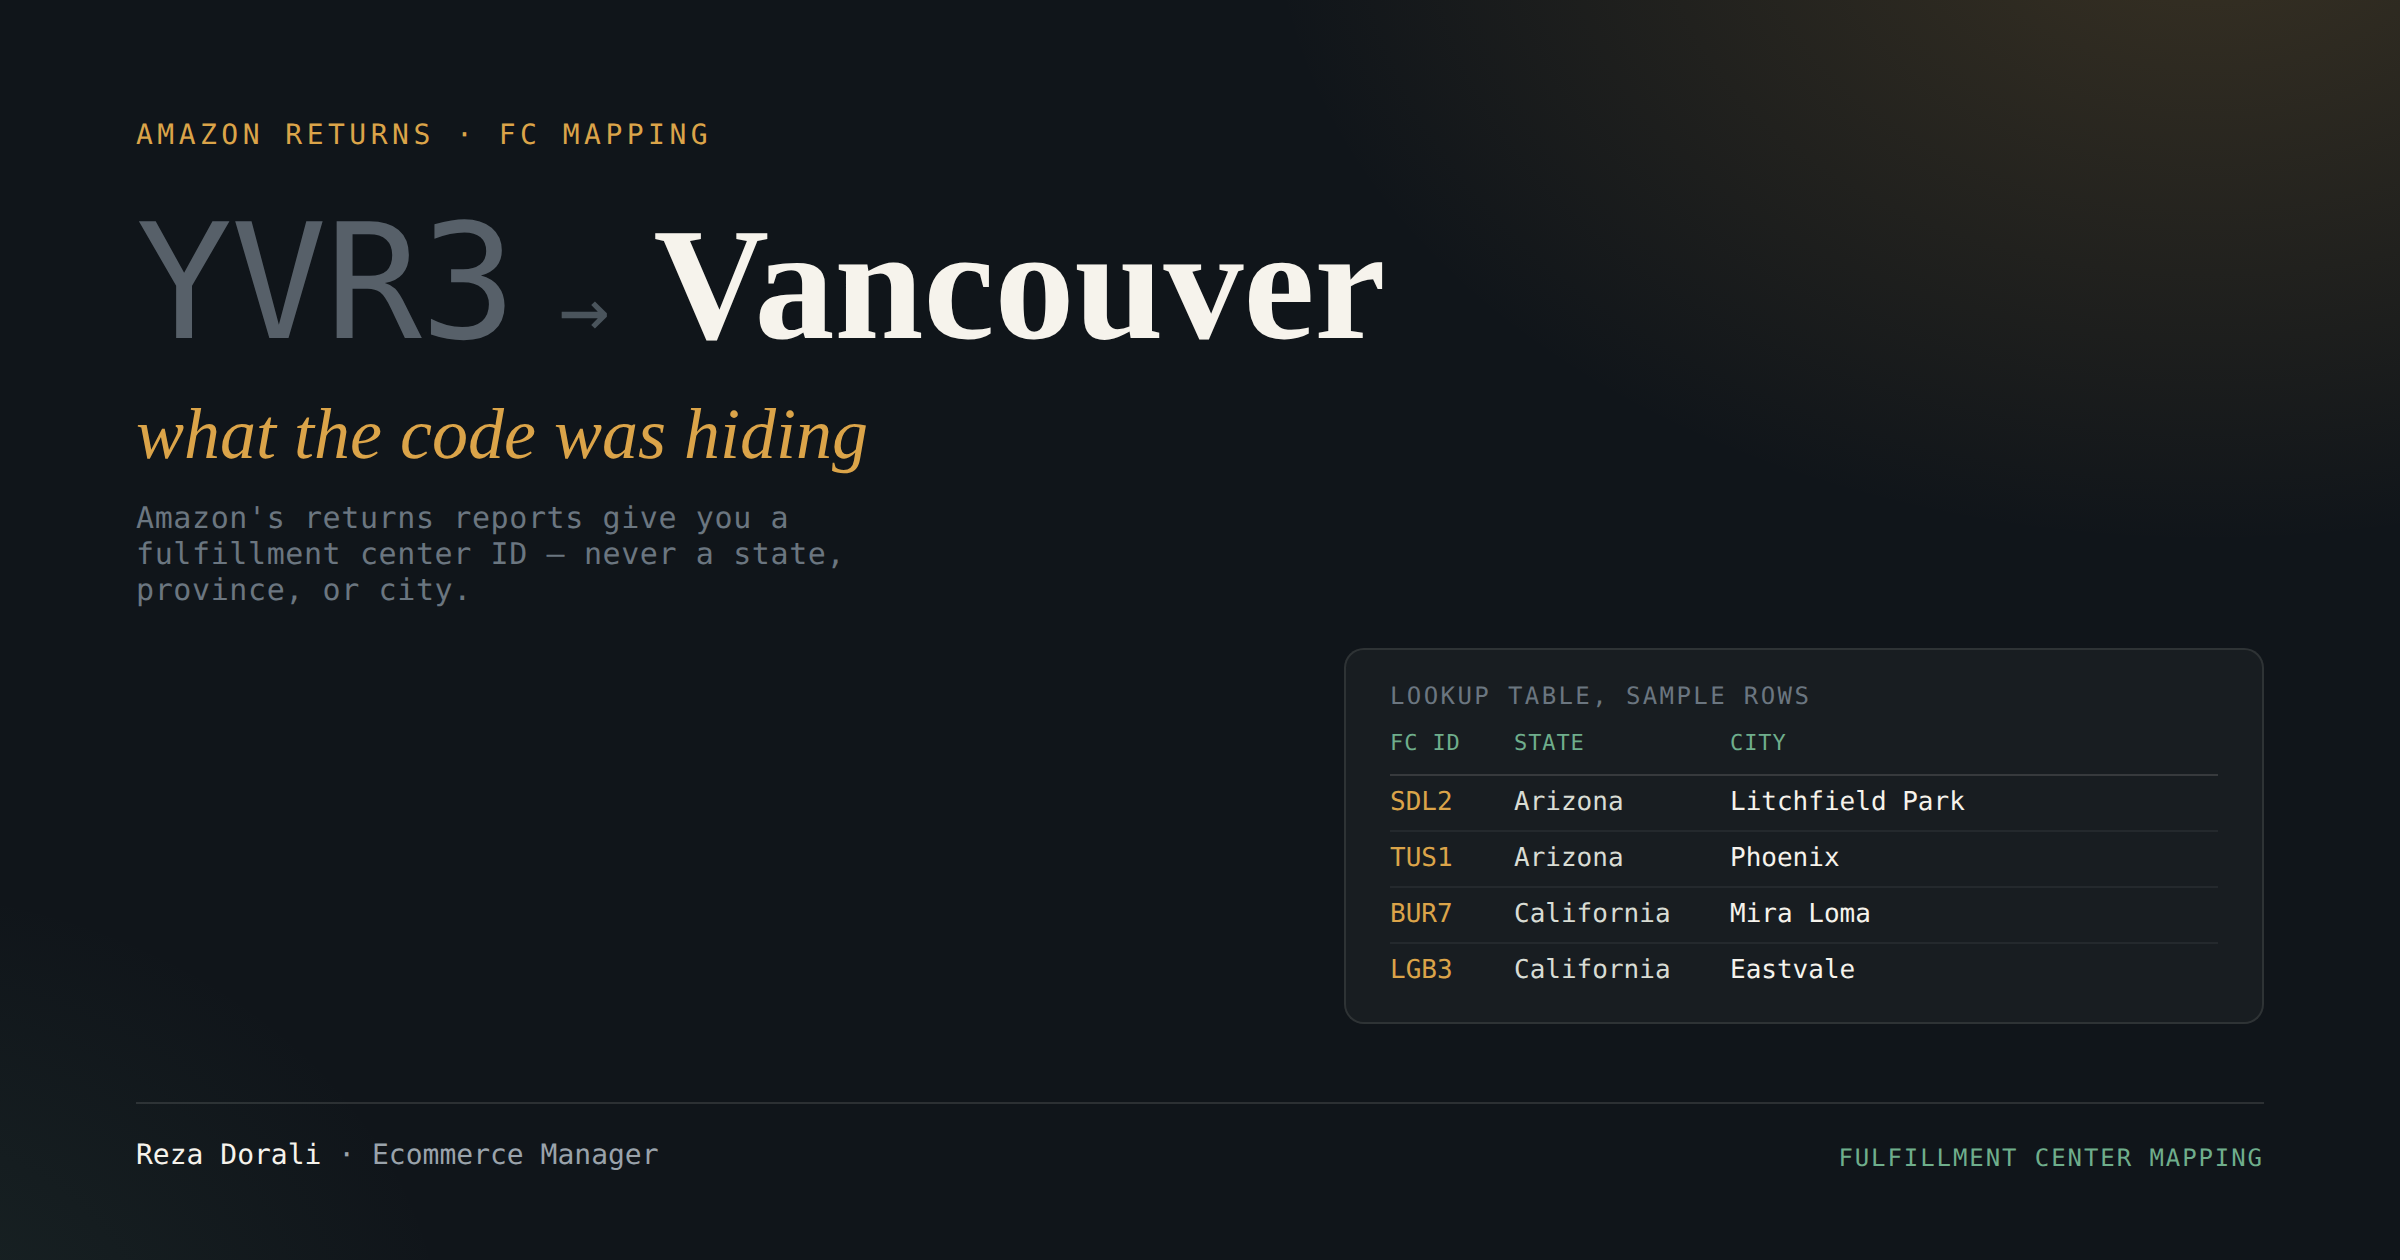
Instead of usable geographic data, the reports contain internal identifiers such as YYZ1, YVR3, PHX6, IND8.
These codes make sense to Amazon's internal systems, but they are not analysis-ready. If you want to compare performance across regions, analyze returns by climate or distance, or understand geographic drivers of operational issues, you're effectively blocked — unless you already know exactly what each code represents.
The Missing Layer: Mapping Fulfillment Centers to Geography
To move forward, I built a lookup table that maps each fulfillment_center_id to country, state / province, and city.
At a high level, the structure looks like this:
| fulfillment_center_id | country | state_province | city |
|---|---|---|---|
| SDL2 | USA | Arizona | Litchfield Park |
| TUS1 | USA | Arizona | Phoenix |
| BUR7 | USA | California | Mira Loma |
| LGB3 | USA | California | Eastvale |
| OAK9 | USA | California | Tracy |
This small but critical layer changes everything. Once the mapping exists, any Amazon report containing fulfillment_center_id can be joined to real geography, metrics can be aggregated by state, province, or region, and internal codes become business-friendly and analysis-ready.
This is the file I ended up building and sharing.
Use Case 1: Returns by State and Province
My original use case was Amazon Returns. After joining the returns data with the mapping table:
- I could analyze return rates by state and province, not just by FC code
- Regional patterns immediately became visible
- Some areas consistently showed higher return ratios
That insight allows you to identify geographic "hot spots" for returns, investigate whether issues are operational, product-related, or environmental, and prioritize fixes based on impact, not guesswork.
Use Case 2: Temperature-Sensitive Products
This approach is especially powerful for temperature-sensitive products. Once returns are enriched with geographic context, you can compare return rates between hot and cold regions, and test whether extreme temperatures correlate with higher returns — looking for specific patterns such as melting, softening, or leakage in hot regions, and freezing, cracking, or separation in cold regions.
This leads to concrete decisions, for example improving insulation or packaging. Instead of assuming "temperature might be the issue," you can prove or disprove it with data.
Beyond Returns: Other Practical Applications
Although I built this mapping layer for returns analysis, it's reusable across many workflows:
Performance by region: Track defect rates, late shipments, or negative feedback by state or province.
Operational diagnostics: Surface underperforming fulfillment centers by aggregating metrics at a regional level.
Compliance and reporting (where relevant): When geography is explicit, aligning operational activity with regional requirements becomes easier.
Any report that includes fulfillment_center_id can benefit from this same lookup layer. Fulfillment center location is not always equal to customer delivery location, but it still provides strong directional insight.
Why This Matters
Two realities of ecommerce analytics: platforms rarely expose every dimension in the exact form analysts need, and missing dimensions lead to incomplete or misleading conclusions.
The key takeaway from this work: a small, reusable mapping table can turn opaque identifiers into intuitive geographic insight, be reused across multiple reports and teams, and convert raw platform data into decision-ready intelligence.
With a relatively small upfront effort, this mapping layer keeps unlocking new analytical value from the same Amazon data.
📥 Download the Mapping File
I built this file while working on this analysis and decided to share it publicly in case it's useful for others. Feel free to reuse or extend it as needed.
Download amazon_fulfillment_center_codes.xlsx ↗
🔗 Additional Sources
More comprehensive lists of Amazon fulfillment center locations can also be found on other public websites. One such source, where this information is available in Google Sheets format:
Google Drive — Amazon Fulfillment Center Locations ↗
Originally published on LinkedIn — comments and discussion are open there.
View on LinkedIn ↗